Container Transport Forecast
Client
Partners
The problem
SME truck companies involved in import/export transport processes from and to the Port of Barcelona didn’t have information about their transport forecast for the short-medium timeframe.
Knowing in advance the number of trucks that will be necessary in future periods is crucial to improve the efficiency and planning of containers that need to be transported by truck, especially for small and medium transportation companies.
The solution
Mosaic Factor’s solution for PIONEERS demonstrates a Containers Transport Forecast for SMEs that are working in the Port of Barcelona ecosystem to improve the efficiency and planning of containers that need to be transported by truck.
Using ML techniques, the solution forecasts the truck movements at the Port of Barcelona based on inbound and outbound data available in the Port Community System.

Fleet optimisation
Our tool proposes a work plan for the next working day optimising the fleet considering business rules (OTs assigned to each company) and preferences defined by the traffic planner. All transport orders are automatically assigned to a truck/driver efficiently, showing the route proposed to the driver.
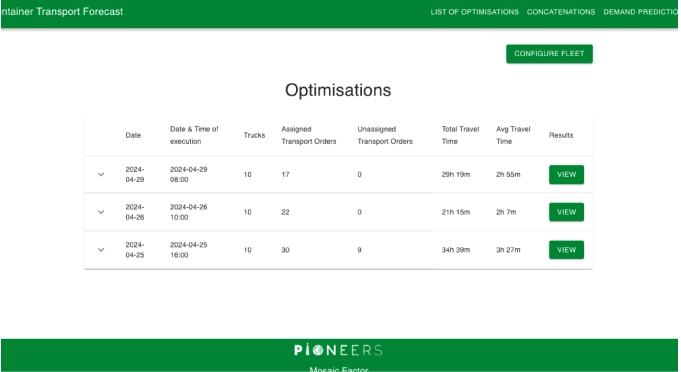
The system predicts the OTs that are assigned to freelancers and the ones that cannot be covered internally and need to be subcontracted to external transport companies.
Prediction of demand visualisation
SMEs in charge of truck transport around the port area need to know in advance how many transport orders will be received in the following days to organise their fleet and contract additional freelance drivers if necessary. This issue is solved by seeing the prediction of demand for the next period (next week).
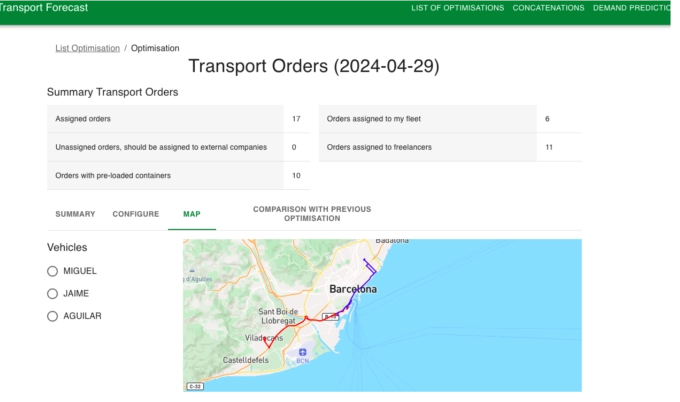
Transport orders can be displayed in a map selecting the different trucks.
Data
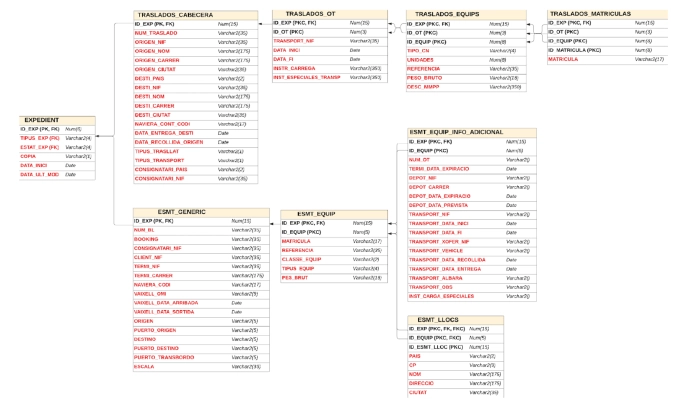
Data from Portic (Port of Barcelona PCS) about Transport Orders:
Fleet data is provided by the truck transport company.
Results
The tool can be visualised here
We are currently working on some KPIs to compare manual processes vs the results of the tool.
Imagery
Some screenshots of the suggested assignments are showed in the below figures:
The top of the screen shows the transport orders that should be done tomorrow, specifying in which way they have been distributed:

Figure 3: Transport Orders summary
The most relevant details of the ones assigned to the own fleet are showed in a table:
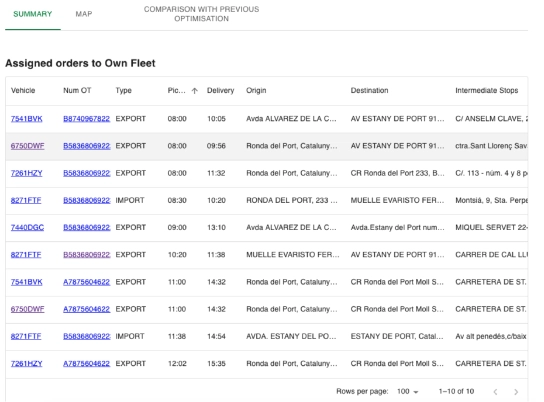
Figure 4: Transport Orders assigned to own fleet
And similarly, the ones that are assigned to freelancers and the ones that cannot be covered internally and should be subcontracted to external transport companies.
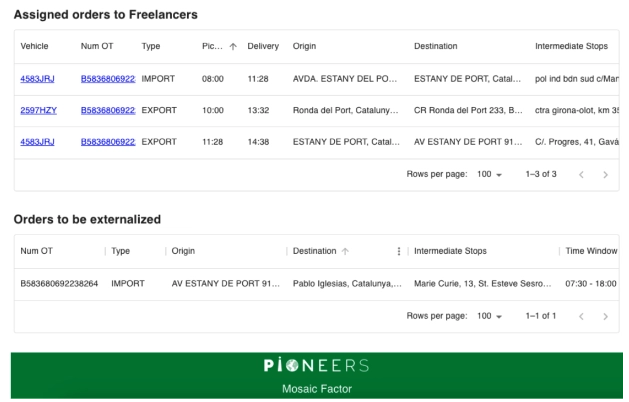
Figure 5: Transport Orders assigned to freelancers and externalised
Clicking on a transport order number, the full detail of the transport order is displayed.

Figure 6: Transport Order full detail
Alternatively, the transport orders can be displayed in a map selecting the different trucks.
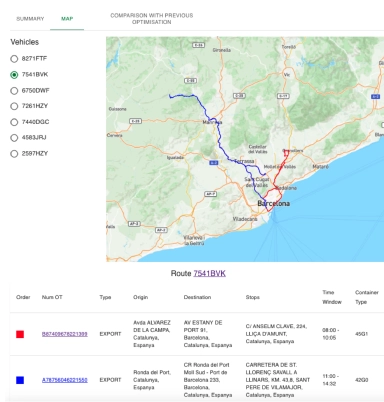
Figure 7: Transport Orders map option
Clicking on a vehicle plate number in the main table, leads to a screen when the user can see the transport orders assigned to that truck.
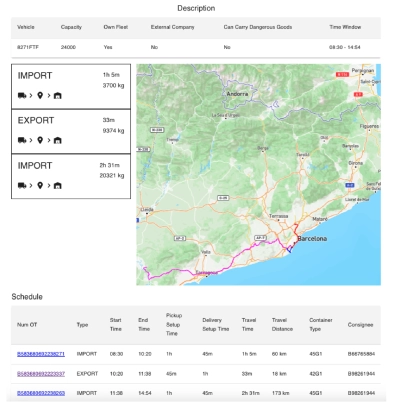
Figure 8: Transport Orders by vehicle
Finally, the user interface also shows the differences between the last run of the algorithm with the previous one.
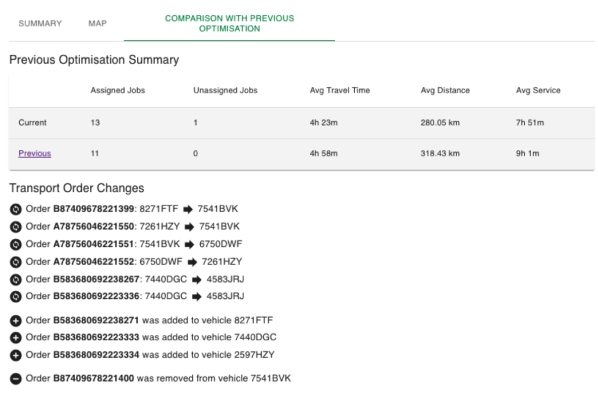
Figure 9: Optimisation algorithm run comparison
Link to test the tool:
https://pioneers-ctf-fe.pioneers.mosaicfactor.es/fleet-optimisation/optimisation

